[python] Visualize the mistaken part in machine learning
- M.R

- Aug 13, 2021
- 1 min read
Updated: Aug 21, 2021
Overview
When doing machine learning, you may want to know "what data the model you created is wrong". Am I making the same mistake for all categories? Or is there a high probability that only certain categories of data will be mistaken? If you know such things, it may be a hint on how to modify the model.
I have created such a method, so I will introduce it.
Method
Create a method like the following.
def wrong_rate(data, target_key, pred, real):

    first_key=data.keys()[0]
    if first_key==target_key:
        first_key=data.keys()[1]

    wrong=pred!=real  #1 mistaken part
    data_wrong=data[wrong]
    #2 count up mistaken part
    data_wrong_group=data_wrong.groupby(target_key).count()
        [first_key].reset_index().rename(columns=
        {first_key: 'Count'}).set_index(target_key)

    #3 total count
    data_count=data.groupby(target_key)
        [first_key].count().reset_index().rename(columns=
        {first_key: 'Count'}).set_index(target_key)

    #4 normalize
    data_wrong_group/=data_count

    return data_wrong_group
data: data target_key: key name to predict pred: prediction value real: real value
First, find the part where the prediction is wrong (1).
Next, group the wrong data by target and count the number of each (2).
Also, find the number of each target (3) and standardize it (4).
Use it as follows. (Data is Kaggle's Forest Cover Type)
wrong_rate(data=data_test, target_key='Cover_Type',pred=y_pred,
real=y_test) 
You can see that the accuracy rate is low for 0, 1, and 2 data.
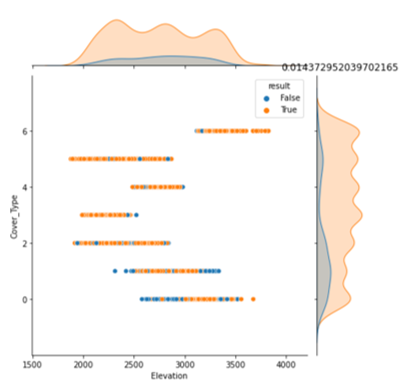
Furthermore, this data is visualized in a graph.
Using the method created in "Visualize the data distribution according to the values of the two items", try to display the data distribution according to the values of the two items, the target (Cover_Type) and whether the answer is correct or not.
data_res=data_test.copy()
data_res['result']=y_test==y_pred

visualize_data(data=data_res, target_col='Cover_Type', hue='result')
data_test: test data y_test: test data of target y_pred: prediction value
The result is as follows. (Only part)


Lastly
I'm still looking for how to utilize this result ...
Methods used in the article is uploaded on my github.


Comments